
TLDR — See our Fear and Greed Index here.
Last year, a fabricated image depicting an explosion near the Pentagon rapidly circulated across social networks, briefly triggering a decline in stocks.
This incident marked the inaugural instance of market movement induced by an AI-generated image.

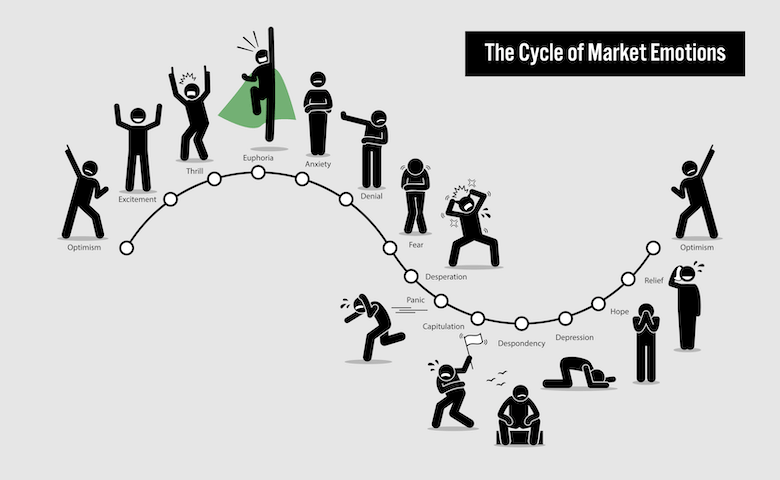
While this indeed prompts discussions about the potential need for regulation around AI, it also steers us towards another discourse — one concerning how market sentiment can sway markets.
Occurrences like this serve as a reminder that markets aren't entirely rational, largely due to the inherently irrational nature of humans. Even individuals with the most logical inclinations can succumb to emotional stimuli overriding their rational judgment.
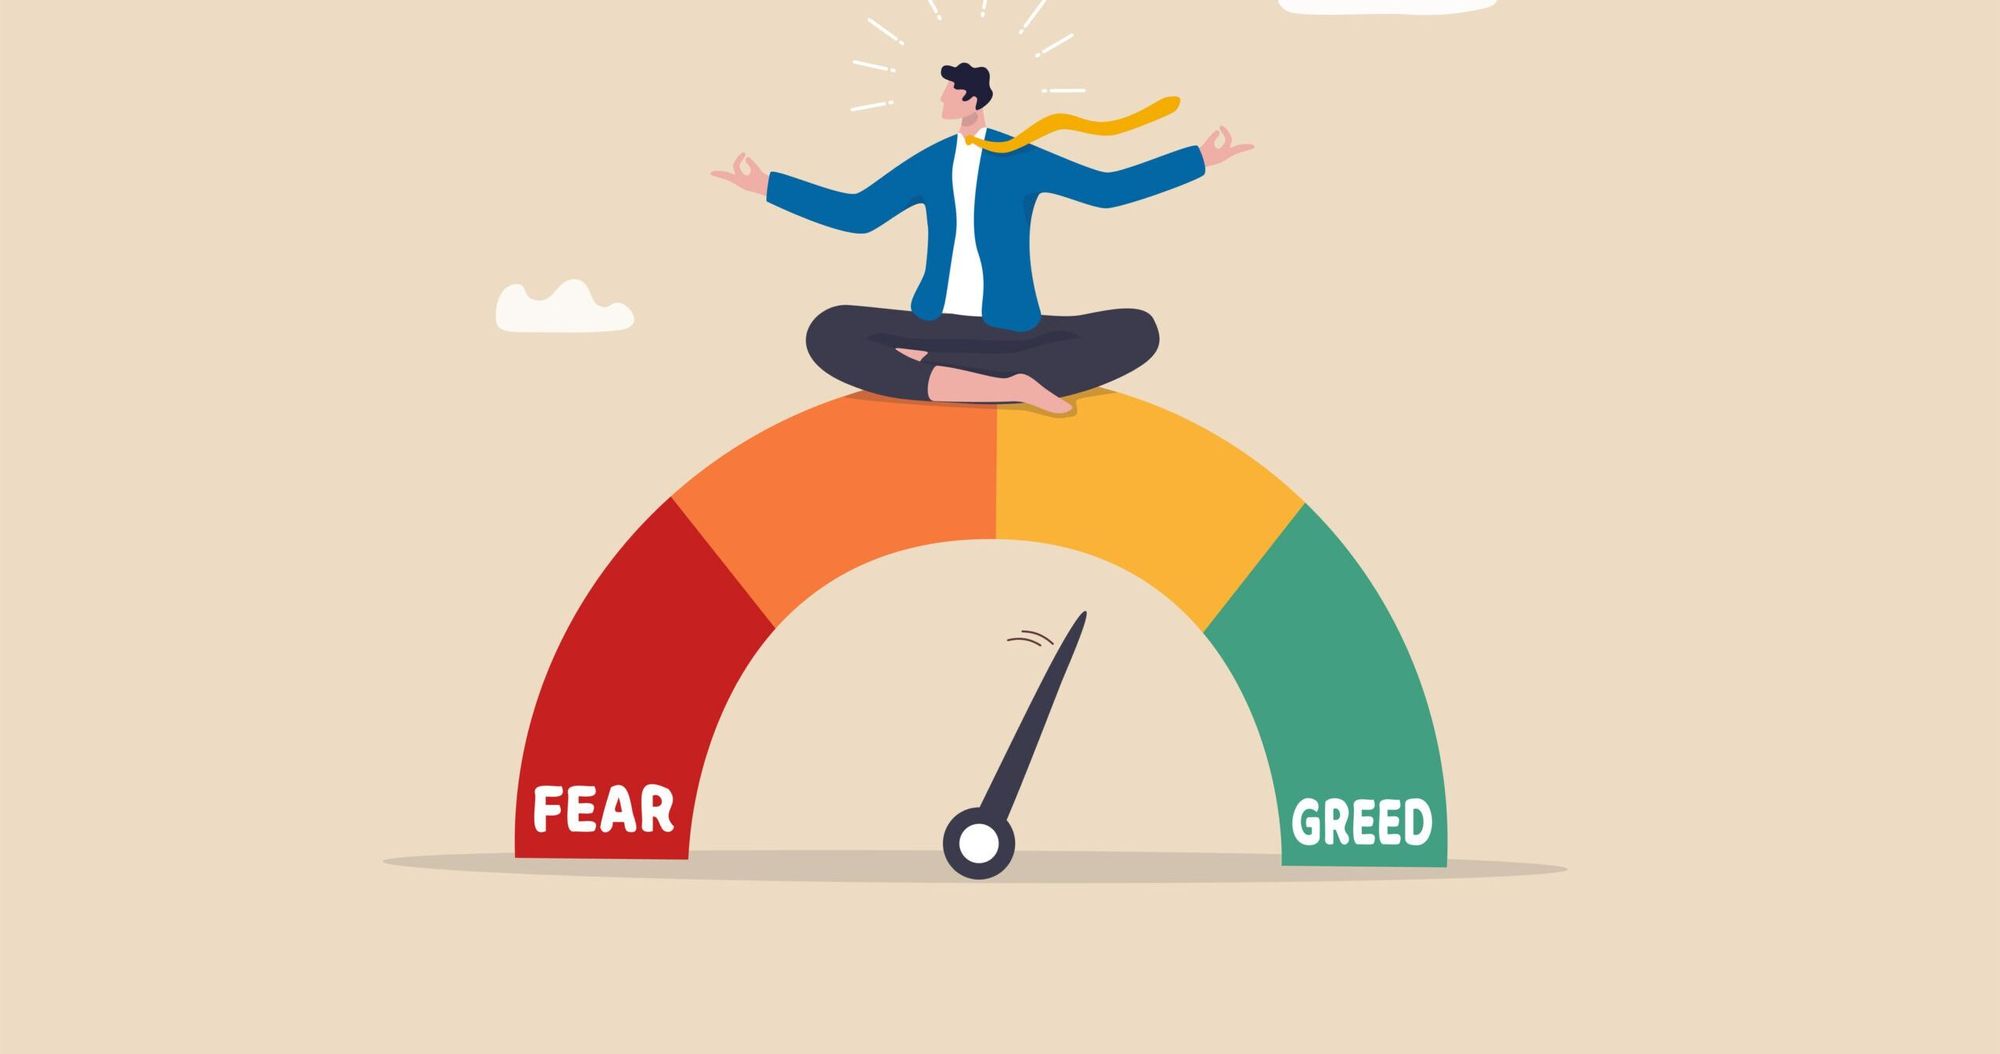
Given that markets can be propelled by fear and greed alone, it's prudent for us to integrate their monitoring into a comprehensive strategy when making investment decisions.
"Be greedy when other are fearful, and fearful when others are greedy."- Warren Buffett
In today's post, we're going to discuss how market sentiment is traditionally measured, as well as how we present market sentiment as part of the Synvestable platform—with an AI twist.
Traditional Indicators of Market Sentiment
Measuring market sentiment is nothing new. First, we'll go over the traditional forms investors have used in the past to try to gauge market sentiment, as well as their limitations:
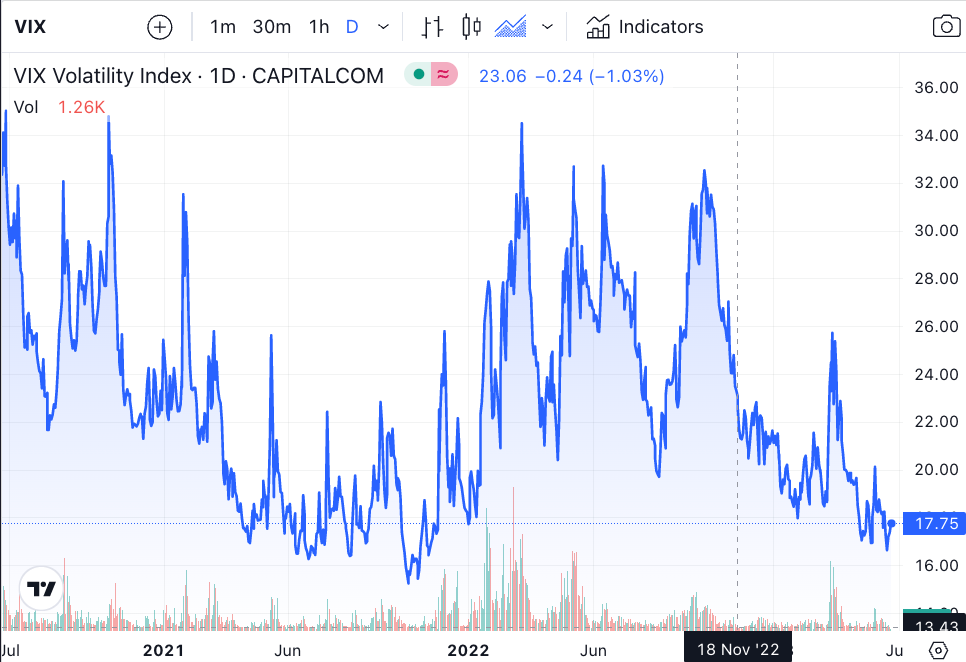
The VIX
The VIX, often dubbed the fear index, serves as a widely-utilized gauge for assessing market sentiment. Derived from the CBOE Volatility Index, it monitors options prices and anticipated volatility over the forthcoming 30 days. By monitoring shifts in the VIX, investors can glean insights into expected market conditions in the near term.
While the mechanics of this index may seem intricate, the implications of the VIX's movements are relatively straightforward. For instance, a rising VIX signals a necessity for investors to shield themselves against heightened risks stemming from increased volatility. Conversely, a declining VIX suggests decreased levels of volatility. Nonetheless, it's crucial to recognize that the VIX doesn't furnish information regarding market direction; its principal role is to track volatility.
Bullish Percent Index
Another indicator of market sentiment is the bullish percent index (BPI), which monitors the number of stocks exhibiting bullish patterns.
When the BPI exceeds 80%, it indicates extreme optimism in the markets, suggesting that stocks may be overvalued. Conversely, a BPI below 20% suggests a predominantly negative sentiment and the possibility of undervalued stocks.
The High-Low Index
The High-Low Index serves as an additional valuable tool for comprehending market sentiment. It evaluates the ratio of stocks achieving 52-week highs to those attaining 52-week lows within a designated index, such as the S&P 500 or Nasdaq.
A reading below 30 on this index indicates a bearish sentiment, while a value of 70 or above signifies a more bullish outlook among investors.
Subscribe For FREE Stock Insights!
And a chance to win free shares of stock.
Commitment of Traders Report
The Commitment of Traders Report (COT) is yet another traditionally used indicator for assessing investor sentiment.
It focuses on commodity traders and reports the futures holdings of a selected group of these professionals. Contrarian investors often utilize this report to analyze the prevailing sentiment in the markets.
Moving Averages
Many investors turn to moving averages to assess market sentiment.
Among the commonly used moving averages are the 50-day simple moving average and the 200-day simple moving average.
As a rule of thumb, when the 50-day average exceeds the 200-day average, it implies a move towards positive sentiment and a bullish outlook.
In contrast, if the 50-day average drops below the 200-day average, it signals bearish sentiment and declining prices in the markets.
Limitations of Traditional Measures

One of the biggest limitations of all these measures is that none of them take into consideration safe-haven asset demand.
To accurately gauge market sentiment regarding stocks, one must grasp the dynamics of demand shifting towards alternative safe havens like bonds.
Another constraint of conventional metrics is their oversight of investor interest in junk bonds. This aspect serves as an indicator of investors' pursuit of returns and their risk tolerance influenced by perceived equity returns.
Junk bonds are issuers of credit that have a higher likelihood of default—the expected return on the bond will compensate for the additional risk, which is indicative as how how "return-hungry" the overall market is outside of the equities markets.
Subscribe For FREE Stock Insights!
And a chance to win free shares of stock.
The last limitation is that all of these traditional measures measure just one or two aspects of the market in a vacuum.
The VIX measures volatility anticipated extreme moves from the derivatives market...and moving averages in a measure of investors expected momentum continuation.
But the VIX tells you nothing about momentum...and moving averages won't tell you much about anticipated large moves.
Luckily, there's an indicator that combines all of these measures of market sentiment into a simple, easy-to-read indicator—from momentum, expected extreme moves, safe-haven demand, and junk bond demand—to price breadth and overall price range movements.
Enter the Fear and Greed Index...
The Fear And Greed Index

The Fear and Greed Index is a tool used to measure investor sentiment in financial markets.
It encompasses all the conventional indicators of market sentiment mentioned earlier, as well as additional ones like the put/call ratio.
At its core, the index functions by assessing the premium traders are willing to pay for assets such as stocks and commodities, relative to their average price over recent periods.
The Fear and Greed Index operates by gauging investors' willingness to pay for assets compared to recent averages.
When prices surge faster than usual (signifying "greed"), it indicates heightened risk appetite as optimism about future growth prospects increases. Conversely, rapid declines in prices ("fear") suggest panicked selling driven by negativity or apprehension.
The index ranges from 0 to 100, with lower figures indicating highly bearish sentiment (widespread selling), while higher values suggest exuberance or unwarranted optimism among investors and asset buyers.
Thus, the Fear and Greed Index provides investors with a more comprehensive gauge of whether it's opportune to adopt a contrarian stance or not.
Fear And Greed Index Limitations
It's important to note that like any market sentiment indicator, the Fear and Greed Index has its limitations.
For example, the Fear and Greed Index is measuring quantitative factors only, meaning that sentiment is scored based on price history and measurable demand factors only.
It does not take into consideration things like news sentiment.
Synvestable's Approach To Market Sentiment

This is why on our Market Page, we approach market sentiment a bit different that allows both premium and free-registered users to analyze market sentiment using a variety of factors.
The VIX
The VIX from our view helps investors measure overall expected market volatility.
Sector Returns
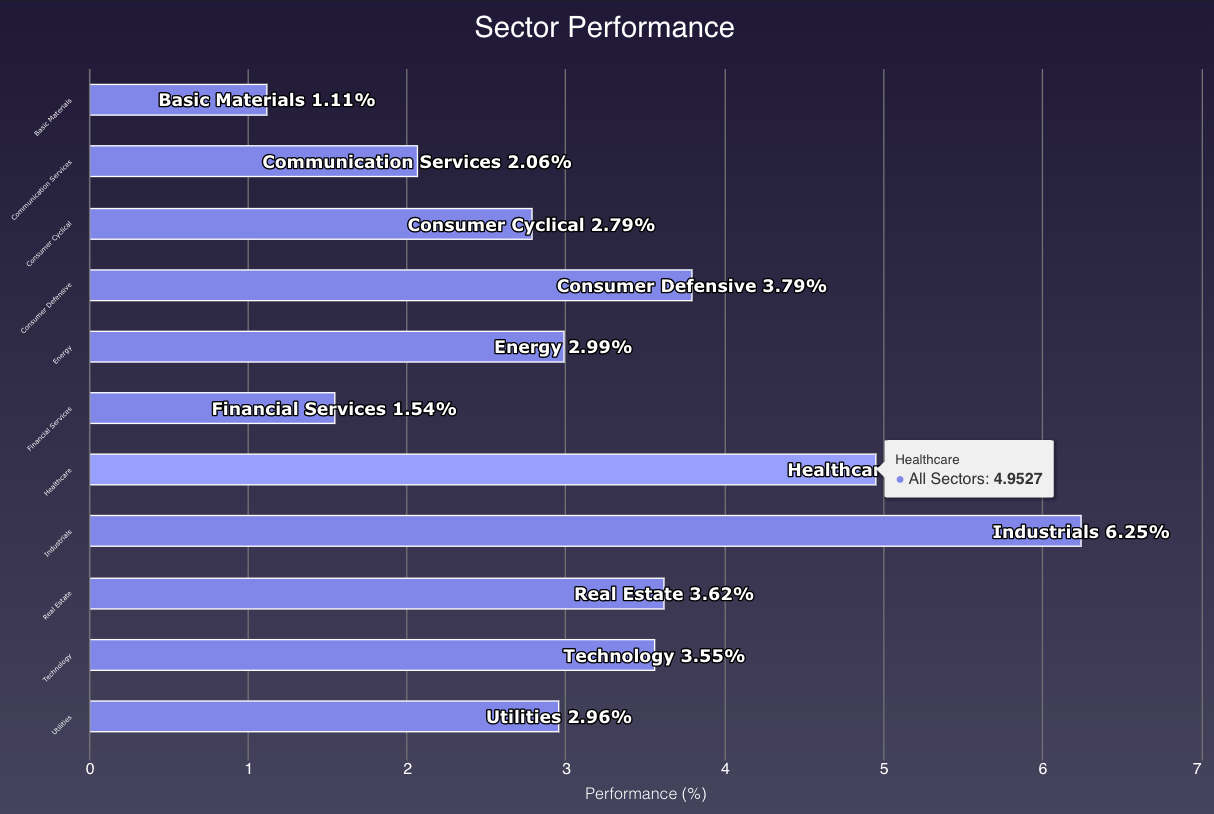
Sometimes fear and greed is sector-based and not within the overall market. For that reason, Sector Performance helps us determine if certain sectors are falling out of favor due to sector-specific news or economics.
Fear and Greed Index
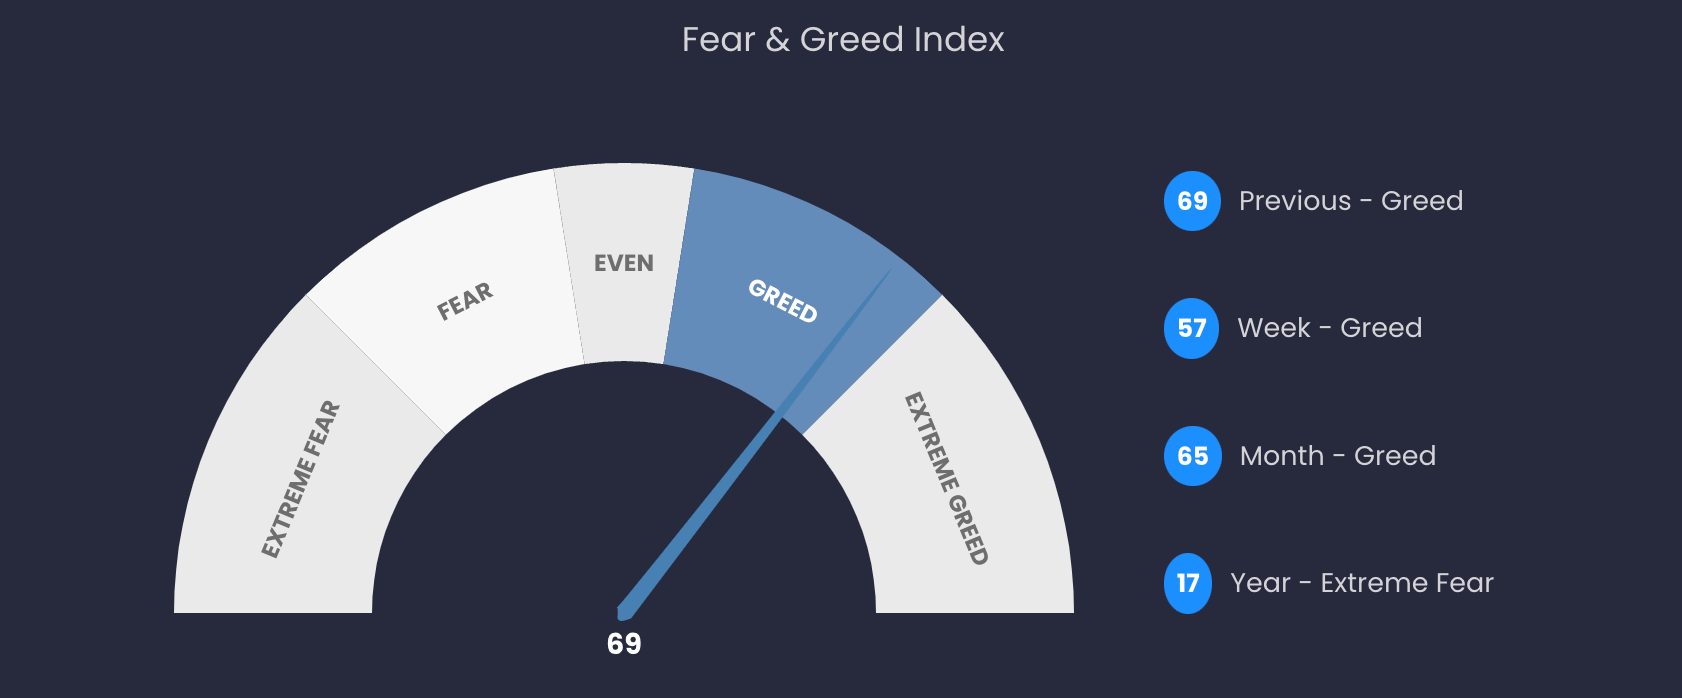
The Fear and Greed Index helps measure all quantitative market sentiment factors, outside of news sentiment. This is a holistic overall measure of market sentiment.
Market News Sentiment
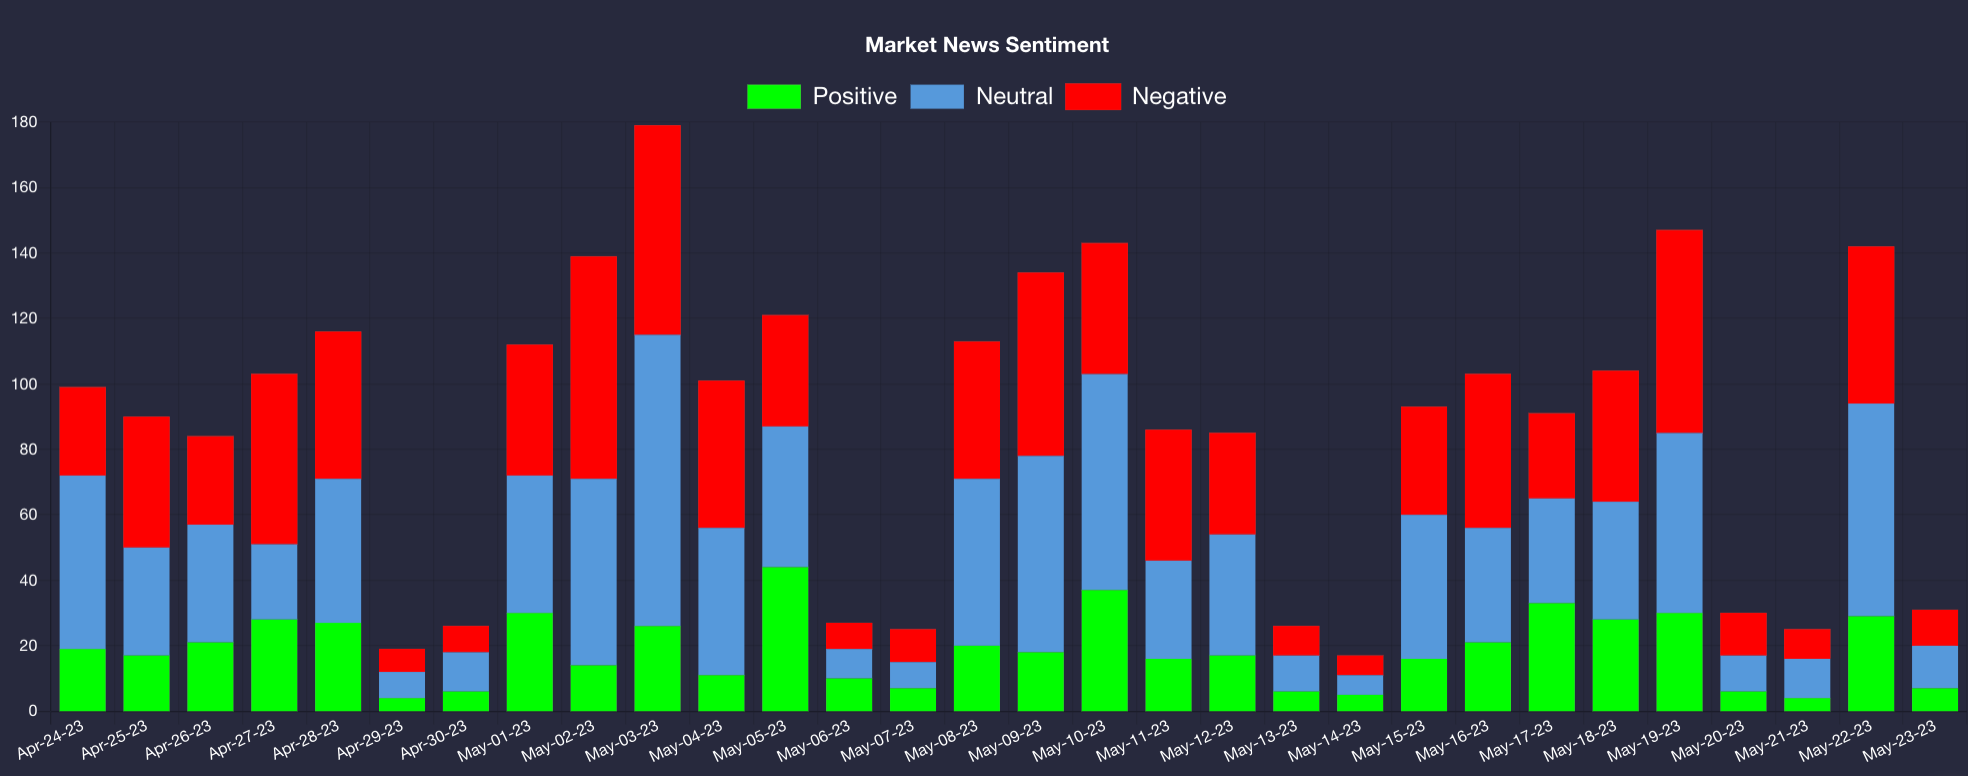
The Market News Sentiment Indicator uses natural language processing (NLP)—a form of artificial intelligence—to measure the sentiment of incoming news headlines and articles for the day.
We also provide this indicator on company-specific news on every company page.
Putting It All Together

Market sentiment alone shouldn't be the sole reason for buying or selling assets, however if you are considering buying or selling assets as part of long-term investing strategy, the market sentiment indicators on the Market Page can help you holistically determine if now is the best time to be buying or selling.
While emotions can undoubtedly influence market movements, they need not dictate your actions.
Employing our market sentiment indicators alongside robust portfolio allocation strategies grounded in valuation, style, and price targets can assist you in making informed decisions about whether to adopt a contrarian, fearful, or greedy approach at any given time.
Register For Free in Seconds! Click The Image
The absolute best app in finance. Register in 3 seconds using your Google Account!