Using Nuclear Blast Detection Algorithms To Forecast Stock Prices
We used nuclear blast detection algorithms to predict the S&P 500—and the results were nothing short of explosive 🚀

I've been fighting the flu since last Wednesday and since I was confined to my home over the weekend, I decided to finish one of my latest machine learning experiments.
Around three years ago, I had a brief conversation with Ernest Chan, former head of Morgan Stanley's quantitative investment group.
One of the questions I asked was if him and his team ever applied algorithms to stock pricing from other domains such as radio communications, digital signal processing, or even geology. I found it interesting when he told me that they hadn't—clearly was still much to be explored in the quantitative research space.
But what does radio signal processing or geology have anything to do with how markets move?
They're actually more related than you think.
For example, below is what a printout from a seismogram—a machine used to measure earthquake intensity—looks like:

And here, I plotted out the volatility of the S&P 500 over the last 4 years:

If I gave you both of these printouts—in the same color and removed the axis labels—you wouldn't be able to tell which is an earthquake reading and which is a market volatility reading.
Because...
All Data Is The Same
Numbers are numbers.
And the relationships between numbers of particulars scales and ratios are reoccurring in nature, this is why you see things like phi and Benford's Law reoccuring in various domains, from geometry to accounting.
That's one of the beautiful things about machine learning—it's all about finding those numerical relationships within the data.
It doesn't matter what the features or even the labels are—square footage, number of dependents, distance traveled, horse or cat, yes or no, true or false—none of those matter, all that matters is the underlying relationships between them...if there is any at all.
The Problems Posed By Nuclear Testing

After the nuclear bombs at Hiroshima and Nagasaki were dropped in 1945, Canada and the U.K. requested a meeting with United States as to what would be done about nuclear weapons.
Combining this with the radiation sickness caused in the islands during the testing of thermonuclear weapons at Bikini Atoll from 1946-1958, there grew a substantial public outcry for governments to convene for the international regulation around nuclear arms testing.
Eventually in 1963, the Test Ban Treaty was signed by the United States, United Kingdom, and Soviet Union that banned all nuclear testing in the atmosphere, outer space and under water.
However, the treaty had one gapping hole—it had no provision banning underground testing of nuclear weapons, simply because there was no way of detecting it.
If a nuclear blast occurs in the atmosphere, outer space, or under water, radioactive fallout and seismic compressions travel far and can easily be detected—but in underground testing, the fallout is contained and seismic compressions can easily be confused with naturally occurring earthquake activity because seismograph readings are highly dependent upon distance to the epicenter.
In other words, the deeper a nuclear explosion, the less it starts to look like a nuclear explosion at all.

The Most Important Algorithm of Our Time
Scientists needed a way to distinguish between naturally occurring seismic activity and nuclear arsenal testing, but how?
Enter the Fourier Transformation...

A Fourier Transformation is when a signal is converted from the time domain to the frequency domain by reducing a time series to its component frequencies.
A good metaphor from music would be if you sat down at a piano and played a G Major chord, the Fourier Transform would return to you the component frequencies of that chord—the frequencies of the notes G, B, and D which make up G Major.
By applying a Fourier Transformation to seismic activity, scientists could now tell the difference between earthquake activity and natural seismic activity because much like a G Major chord in music, a nuclear blast has very distinct component frequencies.
From Nuclear Test Treaties To The S&P 500
So if seismic activity can be distinguished using a Fourier Transform, can different types of market activity also be distinguished?
If a nuclear blast can be identified by its component frequencies, can an uptrend in the S&P 500 also be identified?
I put it to the test.
Below I specially adapted the Fourier Transformation to deconstruct the S&P 500 to it's individual component frequencies (Figure 1) and then use those frequencies to forward predict on a train/test model (Figure 2), followed by a Walk-Forward Prediction (Figure 3).
The results are interesting!

While the prediction isn't a perfect 1-1 move, it did predict the uptrend that just happened over the last two weeks in the train/test model.
According to the walk-forward, over the next 20 days, this Fourier Transformation model is saying that the S&P 500 has a high likelihood of breaking upwards above 4600-4800.
Maybe Tom Lee at Fundstrat has been AI engineer this whole time, Wall Street just didn't know. Interested to see what plays out!
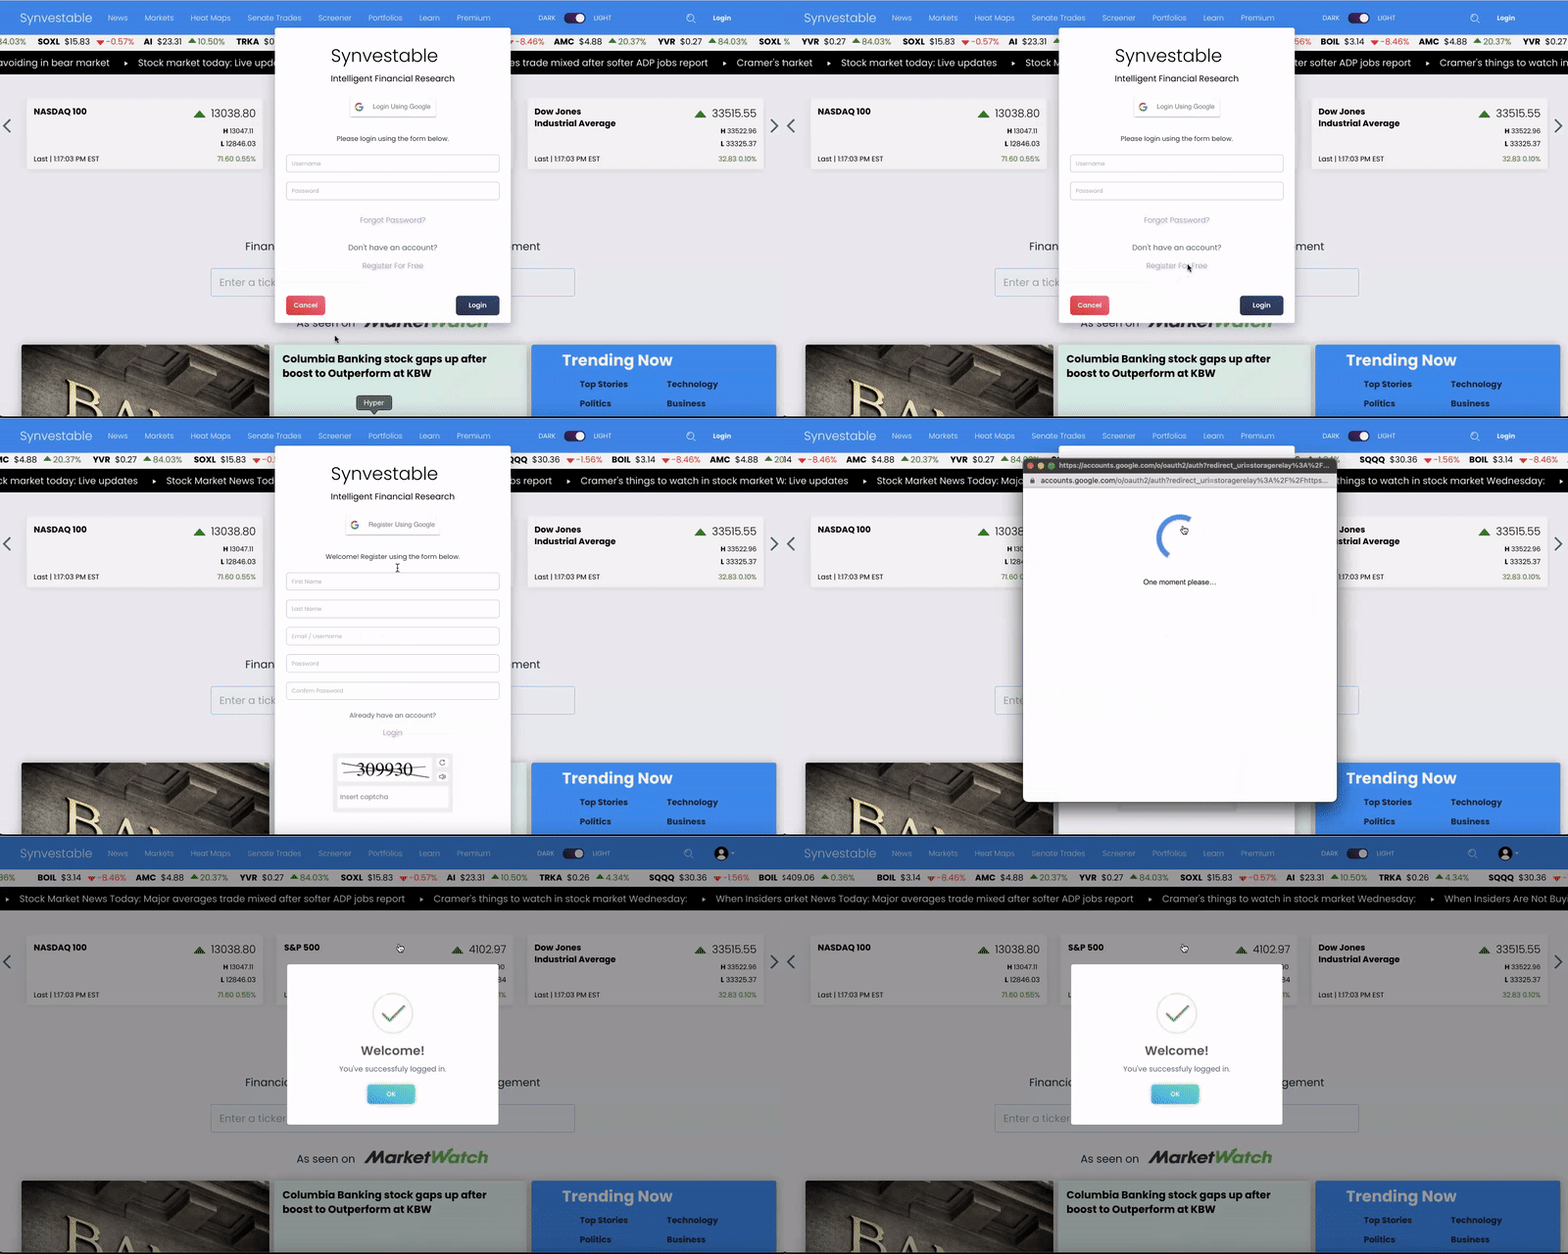
Register For Free in Seconds! Click The Image
The absolute best app in finance. Register in 3 seconds using your Google Account!


