
In today's analysis, we're going to be analyzing the August CPI report which came out this morning hotter than expected, and dissect why inflation is being so stubborn.
TLDR: Interest rates don't matter, real rates matter.
But in order to understand the true driver of inflation, we need to understand a metric that few in the financial community seem to be mentioning.
What Are Real Rates?
Real rates are essentially the effective Federal Funds rate less the prevailing inflation rate.
Real Rates = Federal Funds Rate - Inflation
Real rates are essentially the cost of capital for banks and businesses to borrow within the context of the prevailing inflationary environment.
So while nominal rates exist in a vacuum—2% nominal rates are 2% nominal rates—real rates place the Federal Funds rate into the context of current monetary reality.
While many stock analysts, media commentators, traders, and portfolio managers see inflation cooling at the Federal Reserve's current pace of rate hikes, economists like Steven Roach beg to differ.
Subscribe For FREE Stock Insights!
And a chance to win free shares of stock.
Trust Your Local Economist
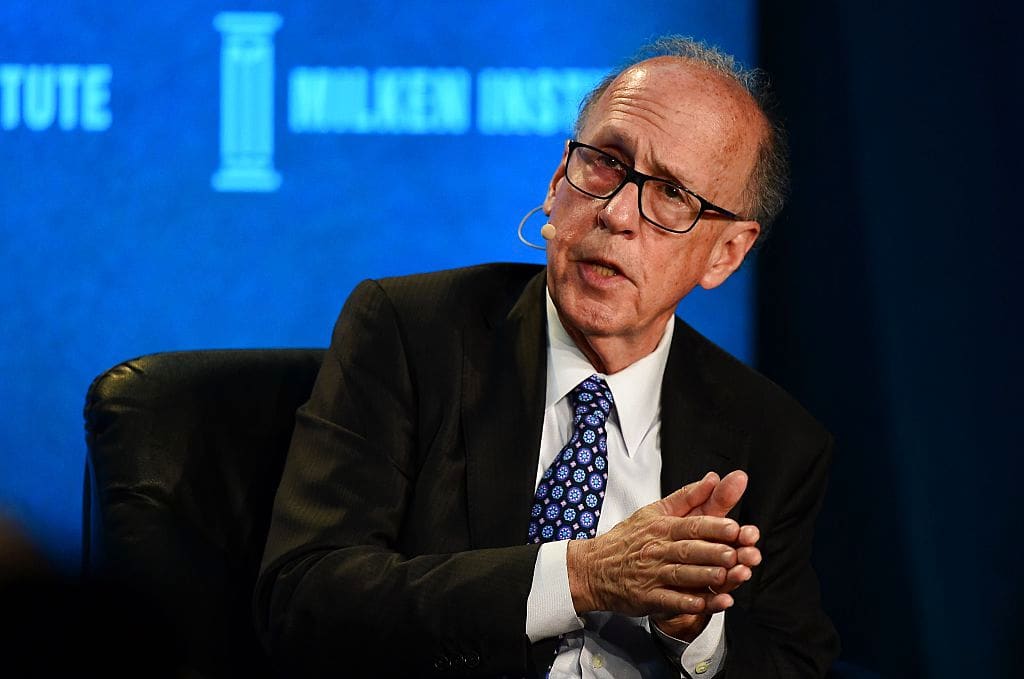
Steven Roach served on the research staff of the Federal Reserve Board from 1972-1979, having a front row seat to The 1970's Great Inflation under Fed Chairman Arthur Burns and later, Paul Volcker. He currently serves a senior lecturer at Yale University's School of Management.
As far back as May 2022, Roach has been highlighting the "Powell-Volcker deficit" in terms of real rates in his writings on Project Syndicate. The key points that Roach made is that it's not nominal interest rates that mattered in the 1970's Great Inflation—but real rates.
Looking back at 1970's inflation, we can tease out some of Roach's wisdom of the importance of real rates when it comes to controlling inflation.
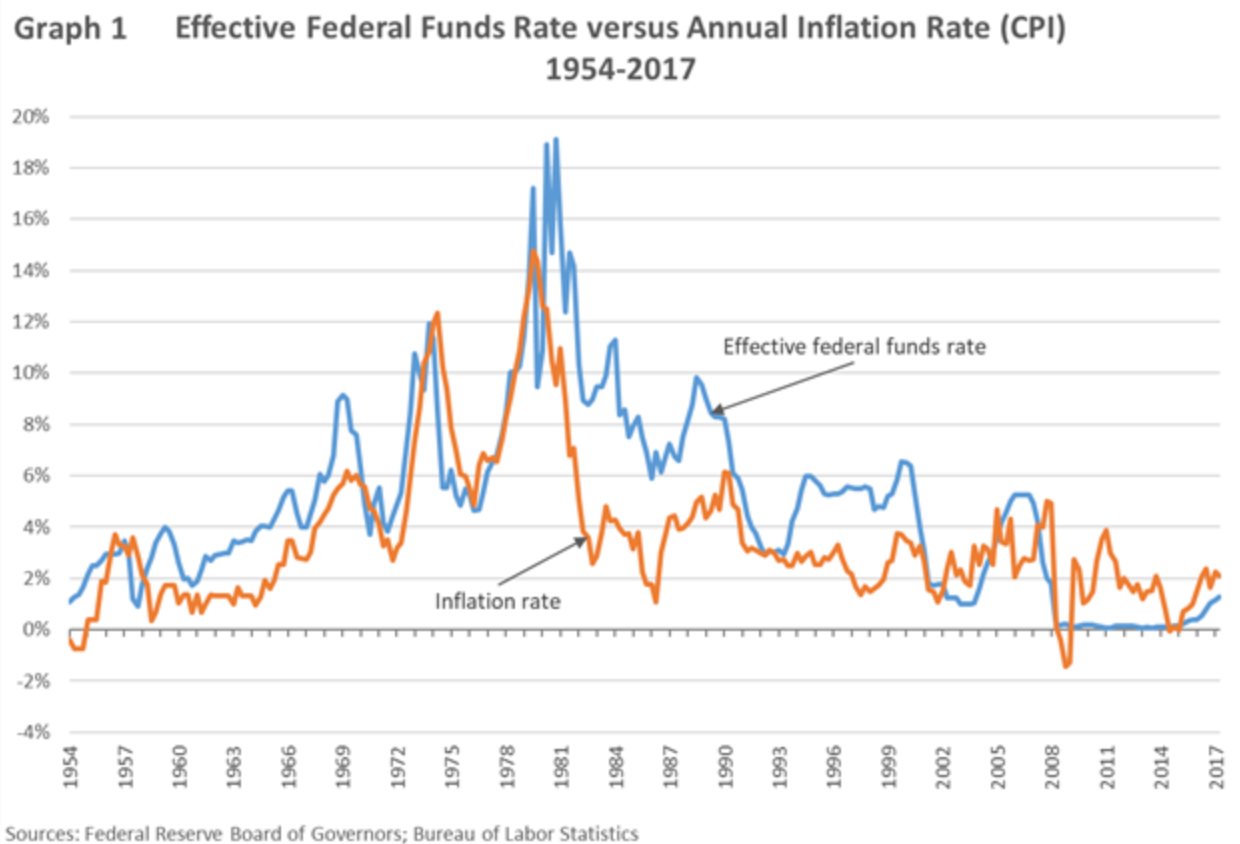
An important observation by Roach is that if you look closely at the Federal Funds rate compared to inflation, real rates never went lower than -2.0% in the 1970's and 1980's.
Just pick any point on the graph prior to 1984 and subtract inflation from the federal funds rate.
As a comparison, current real rates sit at -6.5% —lower than any other time period in financial history.
Roach made the observation that until real rates at least come back to neutral, or ideally go to 1-2%, the Fed will continue to lag the pace of inflation, and inflation could again become a multi-year problem.
If real rates do not go positive, inflation will again become a multi-year problem.
Subscribe For FREE Stock Insights!
And a chance to win free shares of stock.
What The August CPI Report Tells Us
It's troubling when markets are not giving much weight to what Jerome Powell is discussing, and it's even more troubling when the Federal Reserve has not been focusing on "real rates" heavily enough in their discussions.
Economists had been expecting headline inflation to fall 0.1% month-over-month, and the year-over-year estimate had been expected to fall to 8%.
However, the August CPI Report came in hotter than expected—the consumer price index increased 0.1% for the month and 8.3% over the past year.
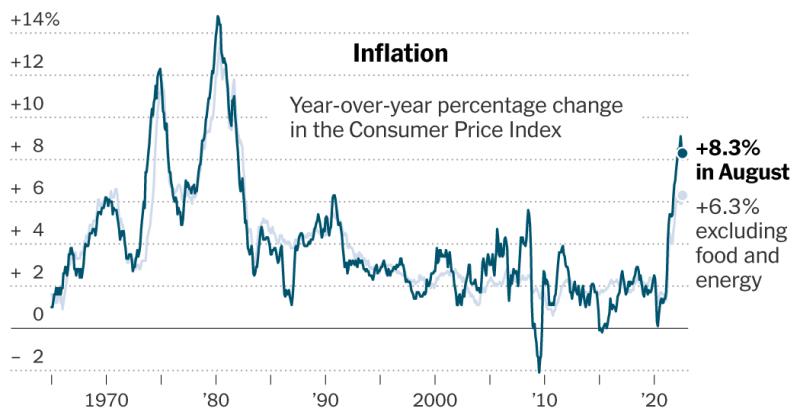
Energy prices fell 5% for the month, led by a 10.6% slide in the gasoline index.
However, even with falling energy prices, inflation still rose—a very telling sign that inflation is not yet under control.
Furthermore, the market will continue to remain biased to the downside because as energy prices have now bottomed and with winter rapidly approaching, rising energy prices leave the potential to drive inflation even higher as energy prices drive the cost of production for all things—from food to consumer goods & services.
Rising energy prices drive the cost of production for all things—from food to consumer goods & services.
Couple this with the threat of supply constraints from Russia and OPEC+ and Farmer's Almanac forecasting the coldest winter to date this year, we have the perfect environment for energy prices to rise, regardless of what happens with the Russia-Ukraine war.
What To Expect From Here
While a positive reading from the CPI Report most likely would not have deterred the Federal Reserve from its aggressive rate hikes, a hotter than expected CPI Report gives them further confidence to do so.
The market is currently expecting a 75 basis point rate hike with a 92% estimated probability, but even more interesting to note—and what nobody seems to be mentioning—is that a 100 basis point rate hike is more than in play at this point.
Why? Because financial history says so.
Below is a table of rate hikes in 1974, when GDP was -0.5% and inflation was 9.1%—eerily similar to today's environment.
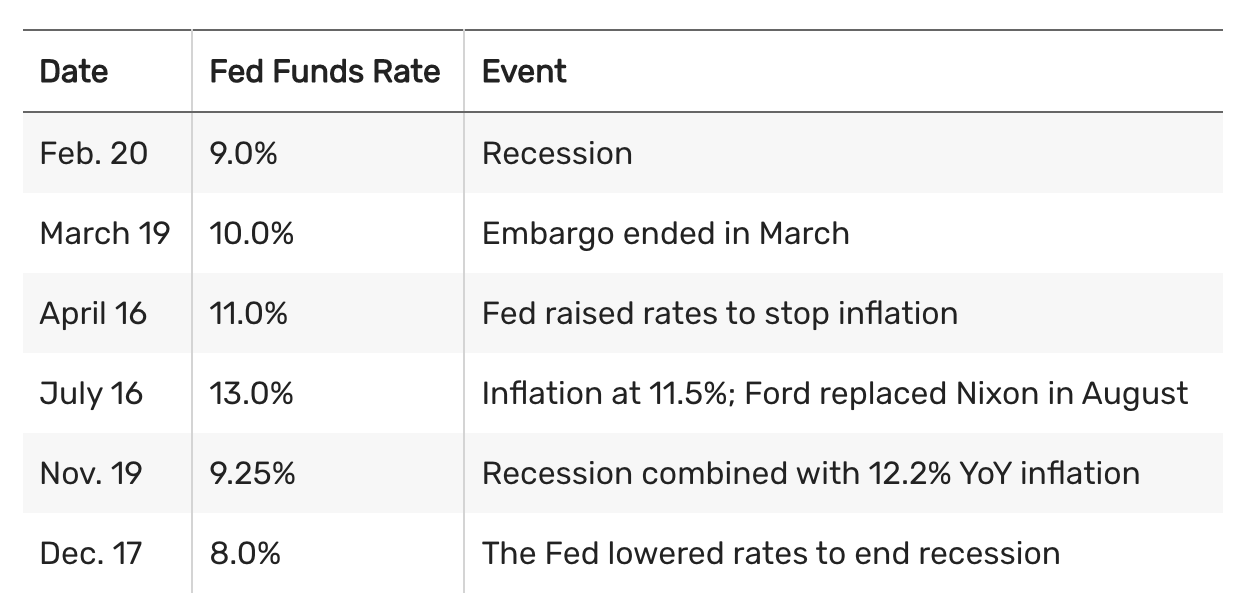
As we can see, the Federal Reserve hiked rates 100 basis points twice in 1974, and even 200 basis points by July 1974.
With the market trying to rally, and media commentators consistently bringing up the narrative on whether to "trust the Fed" vs "don't trust the Fed," it leaves the stage set perfectly for Jerome Powell to really send a strong monetary message that the Fed means business.
Subscribe For FREE Stock Insights!
And a chance to win free shares of stock.
Hopes For A Potential Bottom
With famed investors like Michael Burry and Jeremy Grantham calling for the "mother of all crashes," the evidence is clear that could be the case here.
“It’s likely that there will be considerably more pain before this is finished,” Grantham mentioned in an interview with the Associated Press, arguing that the S&P 500’s fair value is “pretty close to 3,000,” as opposed to the 3,970 where the index is currently trading.
While Grantham's proposed market bottom certainly has merit from a forward-earnings perspective, we wanted to highlight what our CEO & senior analyst John Radosta has highlighted as a potential bottom from a technical level.
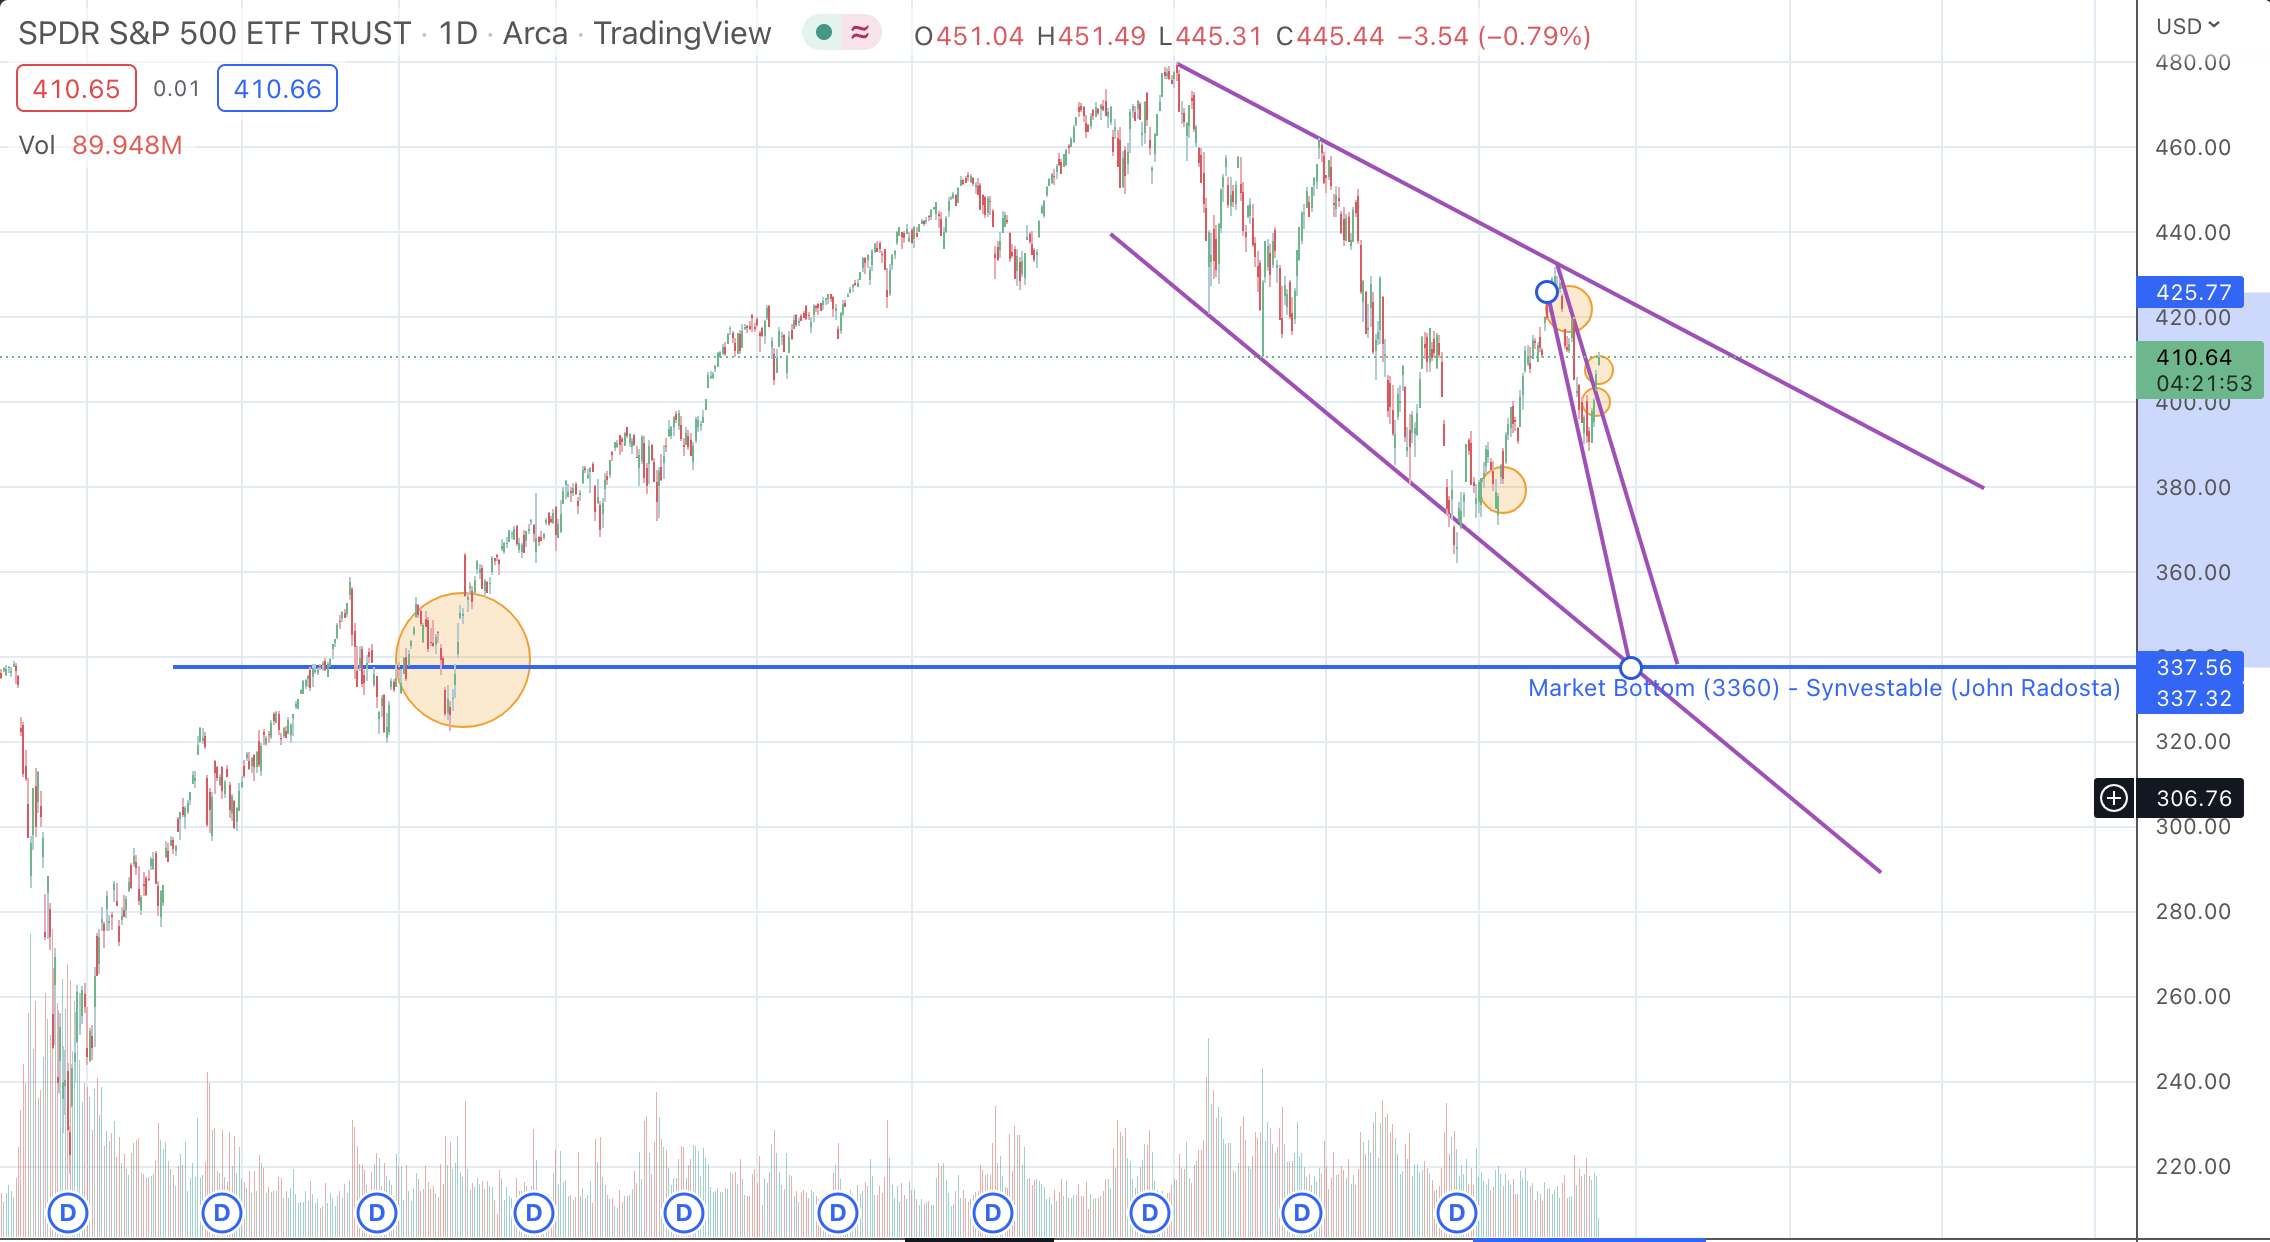
In the above chart, John highlighted several pricing gaps dating back to November 2020 that have yet to be filled.
For those not familiar with the technical term of filling the gap, we can illustrate this better on a micro-level in the diagram below.
Basically, "filling the gap" is a way the market maintains price equilibrium by checking all price levels before moving on to other levels.
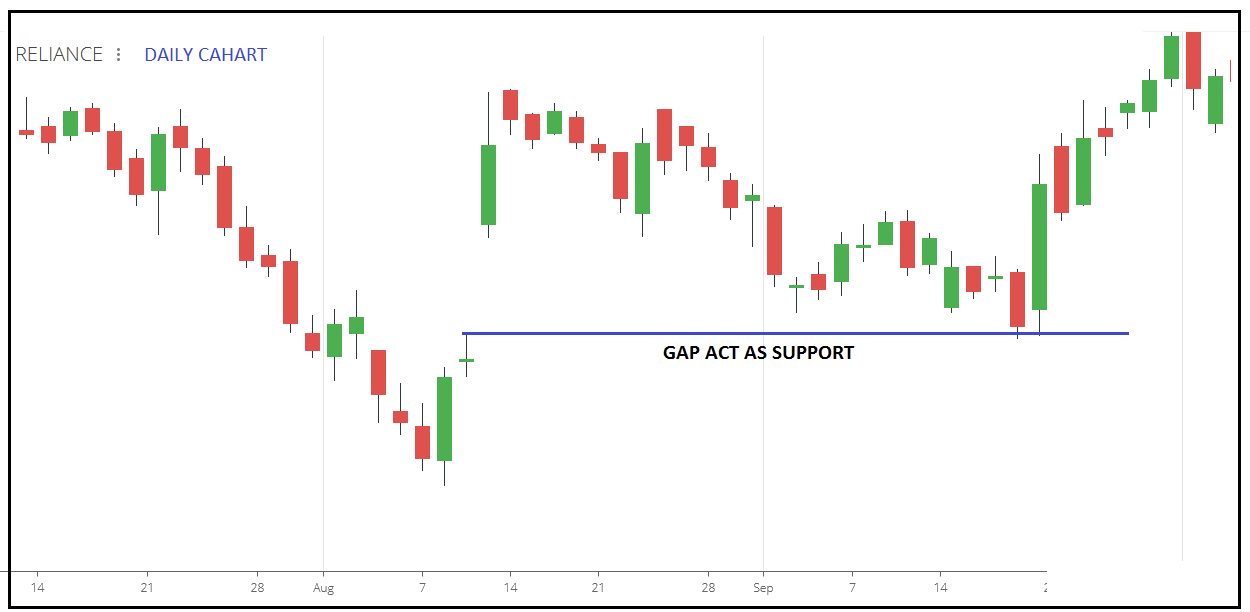
In the diagram, we can see price "gap-up" significantly, before retracing back down to "fill the gap" before moving higher.
The S&P 500 has been gap-filling pretty reliably at all levels, however there are some key price gaps that have yet to be filled that stretches all the way down toward 3360 dating back to November 2020.
Prior to November 2020, all price gaps were properly filled, including during the major COVID-19 crash in March 2020.
We feel that this level coincides with a potential market bottom both on a technical and fundamental level for the remainder of 2022.
As to whether that will remain the market bottom going through FY 2023 is yet to be seen—it depends heavily upon corporate profit margins, inflation, and other risk factors looming over the market such as the housing index.
What Should I Be Doing Right Now?
The dollar index continues to rise, which means cash positions are becoming ever more powerful as earnings and profit margins continue to contract—an observation and warning we made back in July.
While building cash positions is crucial, having low P/E stocks that pay a good dividend yield is another way to help pad your portfolio's coffers in the event of another big dip to the downside.
You also couldn't ask for a better time to be preparing watchlists and model portfolios for when the market does start to baseline again.
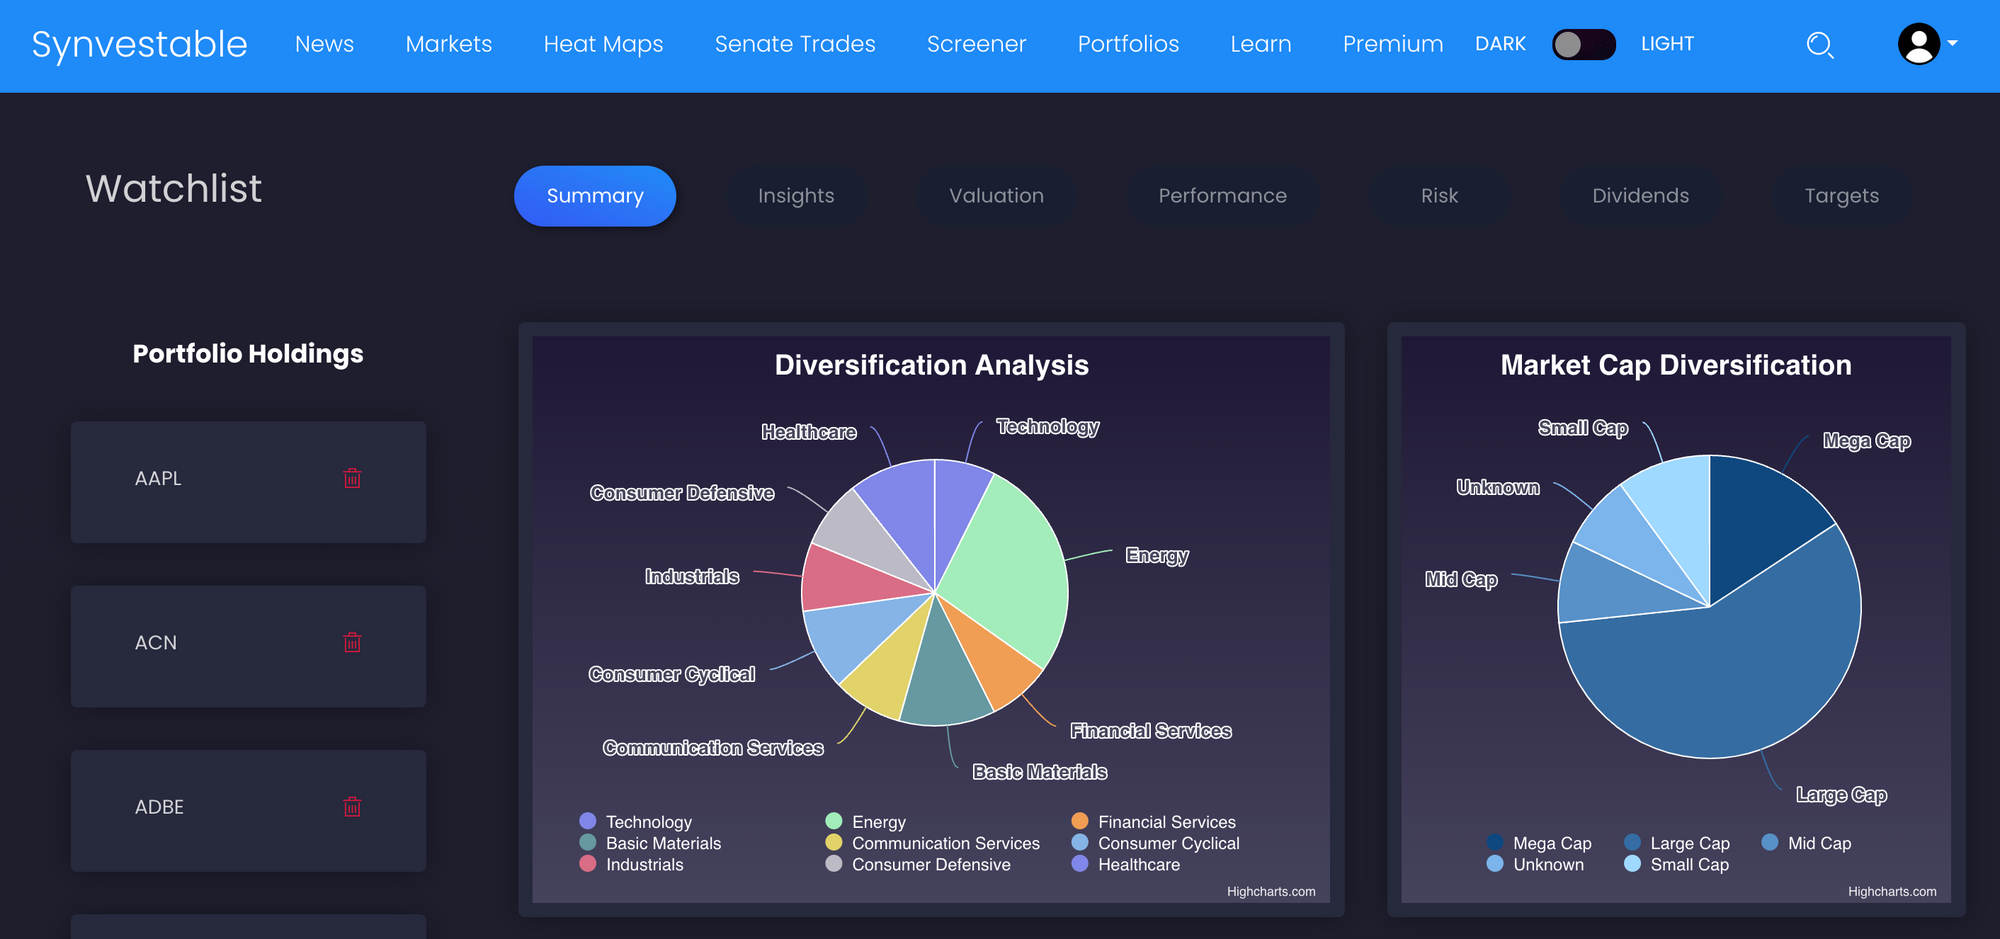
To build amazing watchlists and find great dividend opportunities with first-grade in-depth company analysis on the entire S&P 500, check out our Accredited Premium Plan on Synvestable.com
Register For Free in Seconds! Click The Image
The absolute best app in finance. Register in 3 seconds using your Google Account!
Subscribe For FREE Stock Insights!
And a chance to win free shares of stock.
DISCLOSURE: Synvestable is a financial media provider only and is providing the above data for research purposes only. Please consult your financial advisor before investing as investing carries the risk for potential loss of capital. For more information, please consult our Terms of Use on www.synvestable.com